UGENE Forum | |
https://forum.ugene.net/forum/YaBB.pl
General Category >> Help and How-to >> How to show a quality graph for .ABI files? https://forum.ugene.net/forum/YaBB.pl?num=1246347548 Message started by mats on Jun 30th, 2009 at 2:39pm |
Title: How to show a quality graph for .ABI files? Post by mats on Jun 30th, 2009 at 2:39pm
I'm sure that can viewed a quality graph for .abi files, but i try right now and don't find such option....maybe i'am confused and i viewed a quality graph in another software, but i think that was using UGENE software... :-?
look like this |
Title: Re: How to show a quality graph for .ABI files? Post by Alexey Varlamov on Jul 6th, 2009 at 10:43am
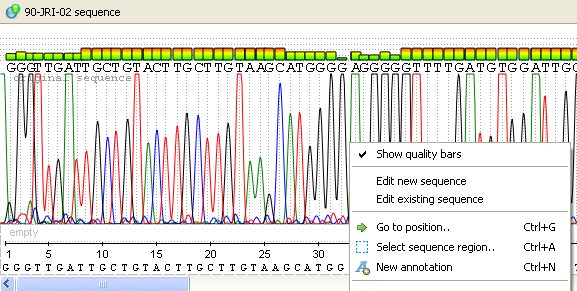
Ugene displays quality values slightly differently, as bars above chromatogram peaks. Since version 1.4.1, the bars can be turned on/off via context menu, as displayed on the attached screenshot.
|
Title: Re: How to show a quality graph for .ABI files? Post by mats on Jul 8th, 2009 at 12:45pm
yep, I know about quality bars, but i thought that Ugene could show the graphic too...I am confused, i don't know where saw that type of plot, what software was......but well, thanks for the answer, and , about the topic, is very useful can see a quality graphic, because is more easy find the zones at extremes of the sequences, the limit where the sequence is becoming a good one, and cut-out the rest for posterior analysis
Oh, what about the colours of quality bars, some equivalence of a phred score, a reference value? |
Title: Re: How to show a quality graph for .ABI files? Post by Mikhail Fursov on Jul 9th, 2009 at 8:42pm
The color scheme of quality bars is rather simple: green - low signal, yellow is medium, red - strong signal. The gradient has linear scale and has no equivalence with phred.
I think we can add the functionality you need the UGENE too. Could you describe the method used to build the line chart on your picture in details? |
Title: Re: How to show a quality graph for .ABI files? Post by mats on Jul 16th, 2009 at 12:14pm
This quality graph are displayed for a service of dna sequencing that I use usually (macrogen).
the red and the green line are phred score, 16 and 20, respectively. I don't know nothing about the method of building, sorry. And thanks for the answers and for the software , Ugene is a very pleasing piece of software, was a very nice surprise for me and my linux system, congrats. :) |
UGENE Forum » Powered by YaBB 2.5 AE! YaBB Forum Software © 2000-2010. All Rights Reserved. |